


Chains, Forks, and Colliders - Causal Graphs
Graphical Structures in the World of Causality

Let me start with an apology for not posting any content lately. No excuses.
I am also available on Topmate now to help people, feel free to block time on my calendar: topmate.io/madhavbhatia
Let’s jump straight to the causal graphs. There are three basic types:
Chains
Forks
and Colliders.
But wait, What are Causal Graphs?
We have all heard and used that “correlation does not mean causation”.
*May be to sound smart in a meeting room. (Looking at myself in the mirror)
However, Causality can be visualized by graphs. Here is quick glance at one graph and its interpretation:
Graph:
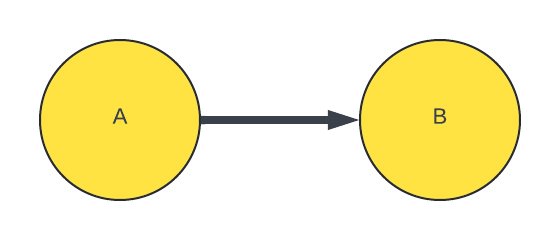
Interpretation:
A causes B
Tip: Look at Arrow. Simple as that.
Awesome. Let’s skip some other fancy stuff and straight to our Graph types.
Chains
Let’s Assume you have a cat. And this happens:

Congratulations! You might be in trouble now.
It is a straightforward sequence where one event directly influences the next.
In a chain, each event is both a cause and an effect, except for the first and last events. The structure can be represented as A → B → C, where A causes B, and B causes C.
In the above example, the Cat jumping on the Laptop to press enter and leading to the email sent is a chain of events.
Classic case of chaos.
Forks
Let’s Assume you have a dog. You come back from work and this happens:

A fork occurs when a single event influences multiple subsequent events.
It can be represented as B → A and B → C, where B is the common cause of both A and C.
In the above example, You coming back from the office and ringing the bell leads to someone opening the door and the dog dancing simultaneously.
Aren’t the Dogs amazing?
Colliders
Let’s assume now that you have a dog and a cat. Here is what happens:
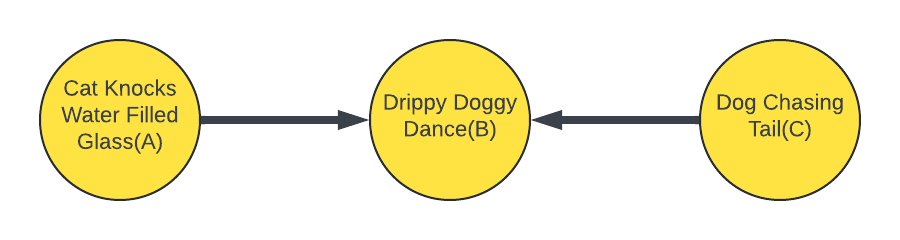
A collider is a situation where two independent events influence a third event. It can be represented as A → B ← C, where B is the effect of both A and C.
In this case, the drippy doggy dance (B) is the result of both the cat's mischief (A) and the dog's antics (C) coming together. It's a hilarious collision!
Why does this representation matter?
Here is a mathematical example for Collider:
Imagine that both A and C are random number generators that produce integers between 5 and 7.
Let's also say that B is the sum of A and C.
Now, let's take a look at the values of A and C when the value of B = 12. (It is fixed!)
The following are the combinations of A and C that lead to B = 12:
• A = 5, C = 7
• A = 6, C = 6
• A = 7, C = 5
Initially, A and C operate independently. It seems nothing is going on.
However, once we focus on the B = 12, a correlation between A and C is visible.
The reason for this is that when we hold B constant and the value of A increases, the value of C has to decrease if we want to keep the value of B constant.
Interesting!
Next time you design an A/B experiment think from the stand of graphs, Is it Chain, Is it Fork or Is it a Collider?
What variable I can change?
What is a confounding variable?
May be graphical representation can help you!
Until next time….